# Dataset
# Dataset requirements
To take advantage of the data visualization capabilities of Finch Studio, your NONMEM dataset should be formatted a certain way. There are not too many requirements, and you may already be following the below rules for your current analyses.
The dataset should have column headers. The header can be commented out in the NONMEM control stream in the usual way (e.g. IGNORE = C, IGNORE = @, etc.)
Finch Studio parses data by commas and spaces. Care should be taken to ensure there are no extra spaces within cells of the dataset. If the dataset was created programatically, for example with R or SAS, this is typically not an issue.
ID, TIME, and DV headers should be present in your dataset. For other columns, it is recommended to use the corresponding NONMEM variables for the names of the data columns when possible (i.e. AMT, CMT, EVID, MDV, RATE, II, SS, etc.)
See an example dataset snippet below.
| C | ID | TIME | DV | AMT | EVID | MDV | CMT |
|---|---|---|---|---|---|---|---|
| 1 | 0 | 0 | 100 | 1 | 1 | 1 | |
| 1 | 1 | 8.12 | 0 | 0 | 0 | 1 | |
| 1 | 2 | 6.49 | 0 | 0 | 0 | 1 | |
| 2 | 0 | 0 | 100 | 1 | 1 | 1 | |
| 2 | 1 | 9.52 | 0 | 0 | 0 | 1 | |
| 2 | 2 | 5.42 | 0 | 0 | 0 | 1 |
# Selecting your dataset
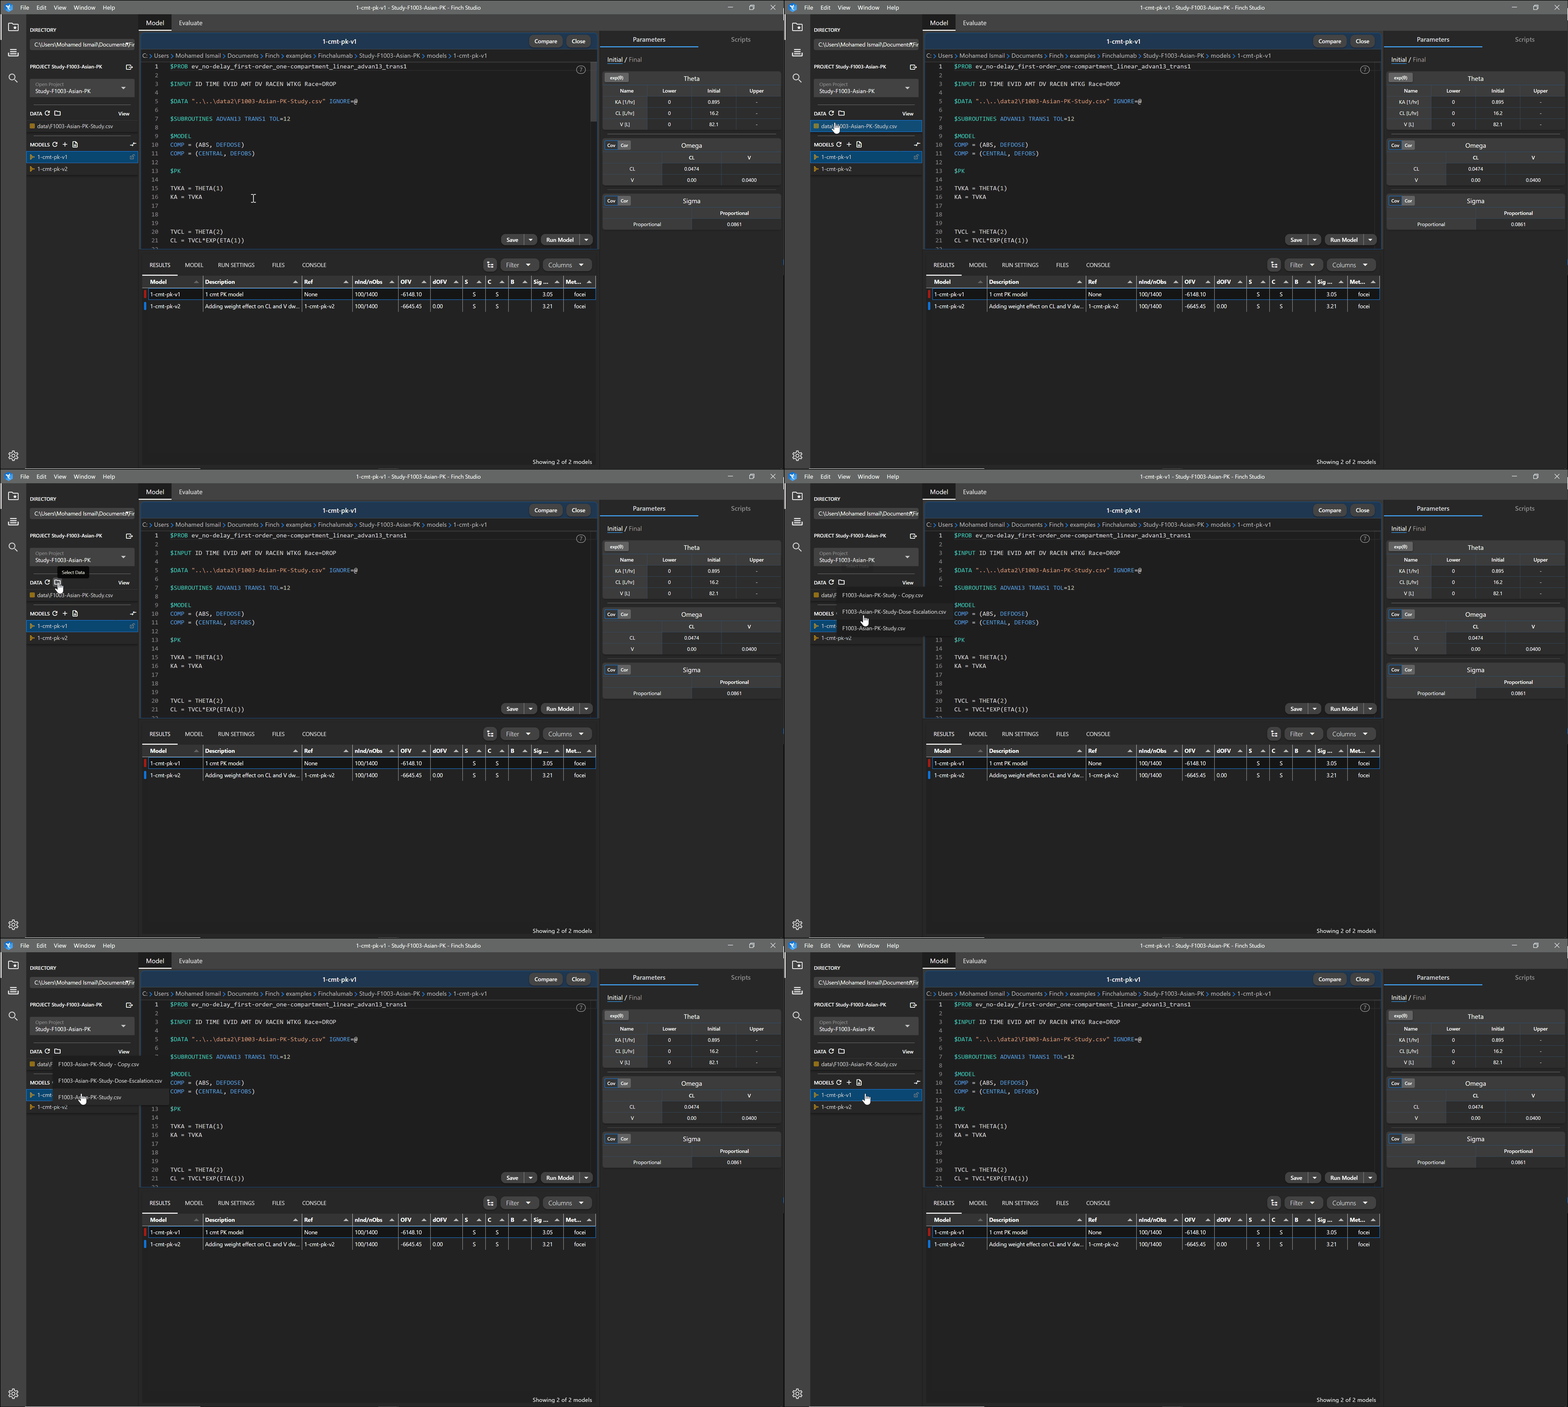
Any dataset to be used in the analysis should be placed in the ./project/data folder. You may view all datasets within that folder by clicking on the folder icon in the DATA section on the left panel. Click on the name of the dataset you wish to work with. The selected dataset will then be used for data visualization purposes, as well as when creating a new model control stream the $DATA path will be set to the path of the selected data file. Additionally, $INPUT will be automatically populated based on the column headers in your data file.

# Mapping your data
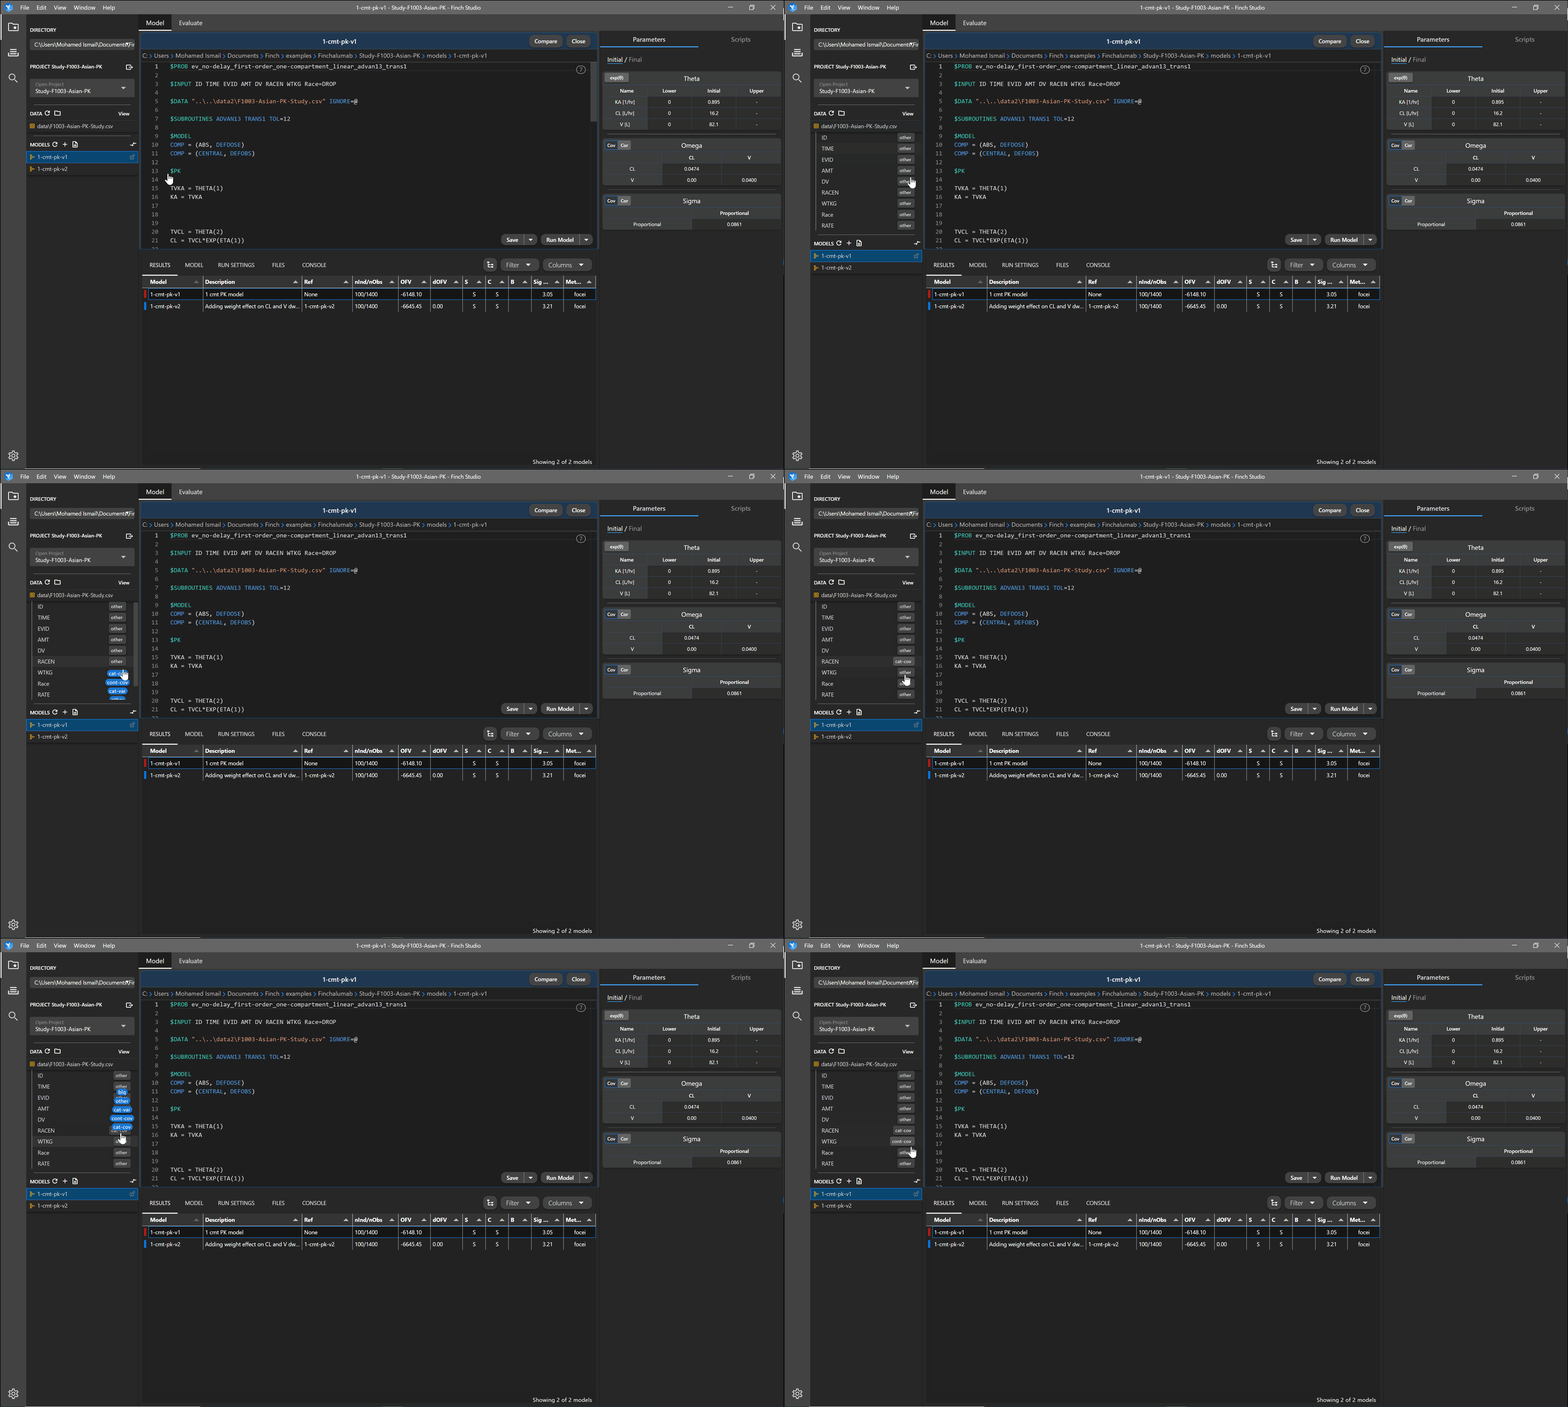
To take full advantage of the exploratory graphics within Finch Studio, the application needs to know what data columns correspond to what variable types. Once a dataset is selected, you can click on the dataset name to show the column names within the dataset. Next to each column, you can specify the type of variable it is (mapping your data). The table below shows the options for mapping your data and the effect it has within Finch Studio.
| Data Type | Description | Effect |
|---|---|---|
| cont-cov | Continuous Covariate | Variable is made available in the exploratory plots right panel under Continuous Covariates. Variable is added to the cotab1 $TABLE in the NONMEM control stream when creating a new control stream. |
| cat-cov | Categorical Covariate | Variable is made available in the exploratory plots right panel under Categorical Covariates. Variable is added to the catab1 $TABLE in the NONMEM control stream when creating a new control stream. |
| cat-var | Categorical Variable | Variable is made available in the exploratory plots right panel under Categorical Covariates. Variable is added to the sdtab1 $TABLE in the NONMEM control stream when creating a new control stream. |
| blq | Below the Limit of Quantitation | Makes available some BLQ plotting functionality. Variable is added to the sdtab1 $TABLE in the NONMEM control stream when creating a new control stream. |
| other | Other | Not one of the above data types. Can be used for most data columns |
While cat-cov and cat-var have similar functionality, cat-var should be used when wanting to statify/color your plots based on the variable, but not consider it as a covariate. This can include things like PERIOD, STUDY, or even your OMIT or C columns if wanting to filter out data rows from your exploratory plots.

# Viewing your dataset
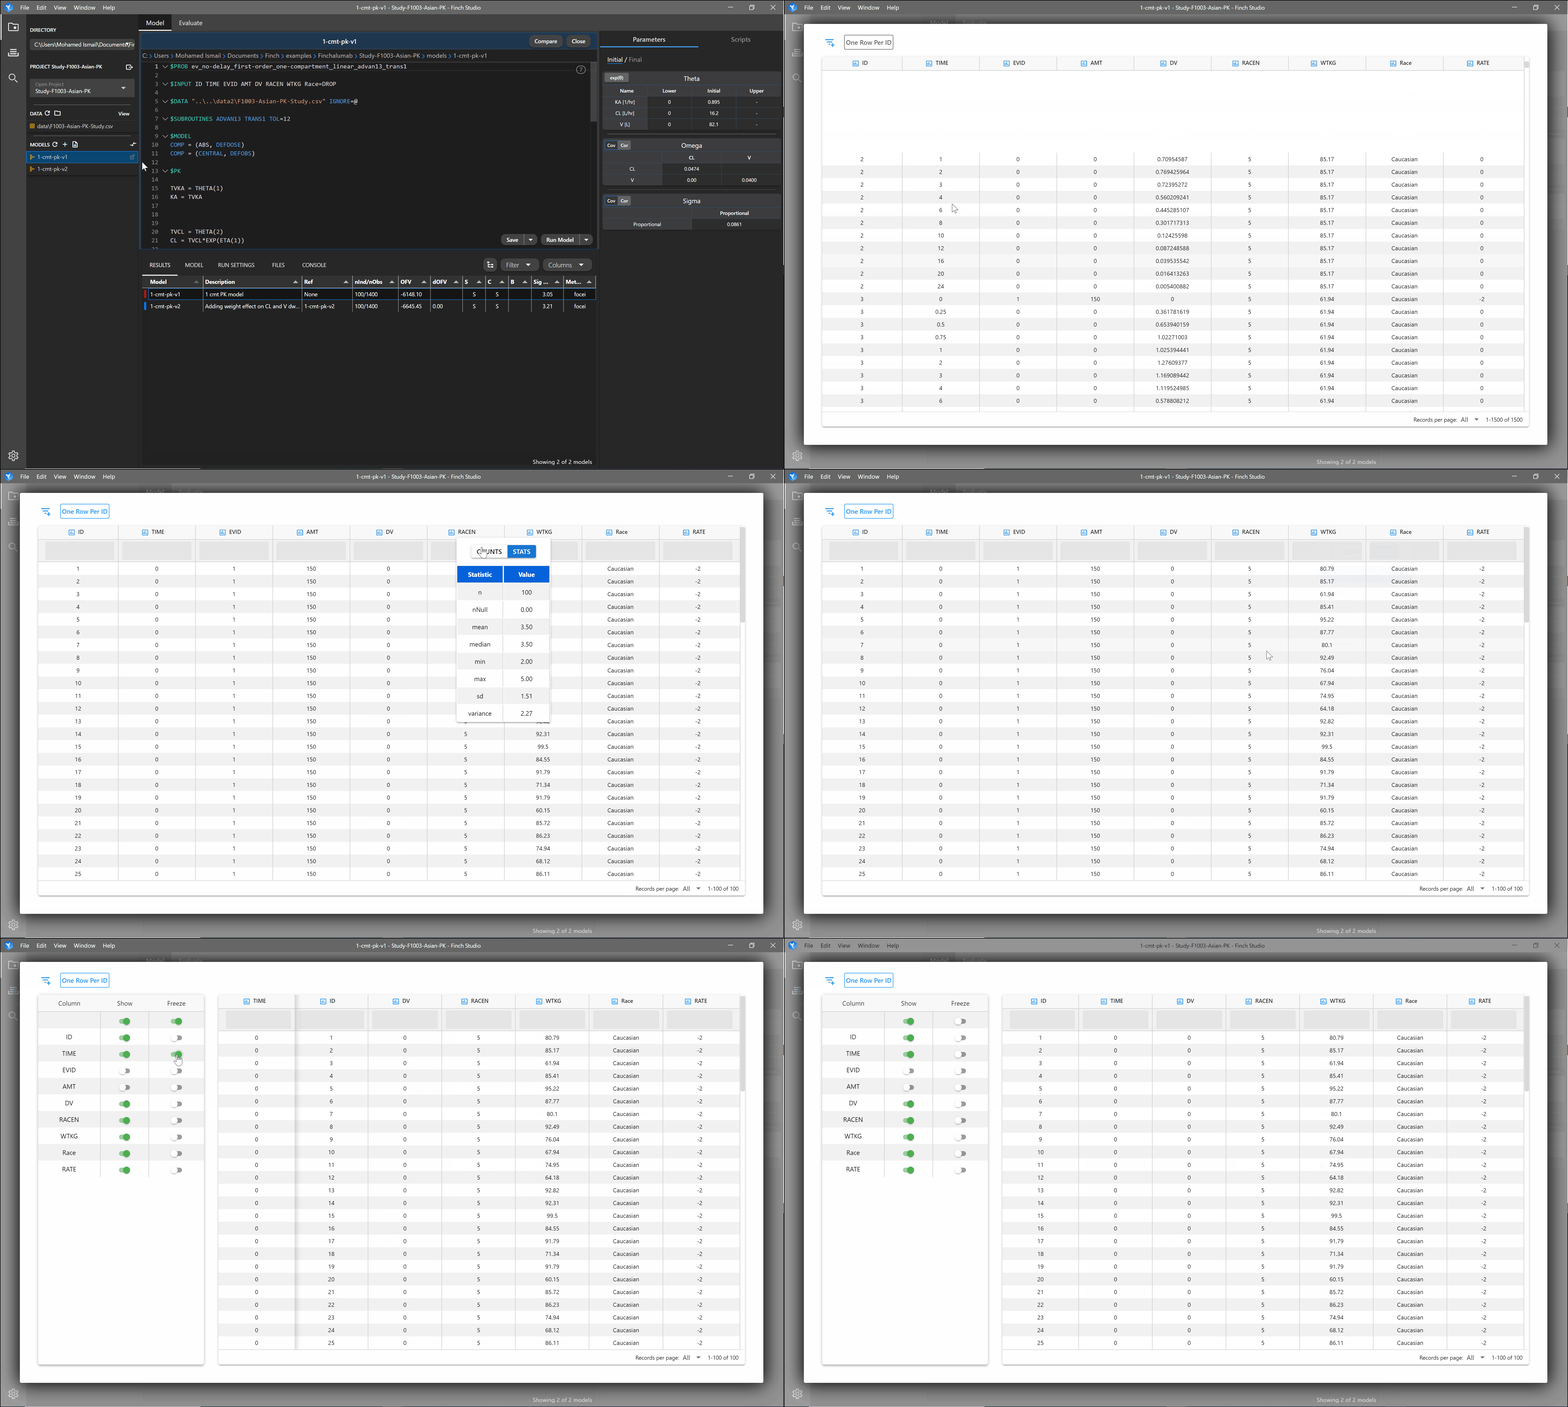
You can explore your raw dataset by clicking on the View button in the DATA section on the left panel.
# Basic Summary of Columns
Click on the blue icon next to a column header to see a quick summary of data for that variable. Toggle between counts and stats depending on the type of variable it is.
# Interacting with the Data
You can do some quick exploration of your dataset within the Finch interface. Type in the space under the column name to filter for specific values. Click the one row per ID button to filter the data to show only one row for each subject. If you have a very large dataset, you may also hide columns within the data explorer and/or freeze a column so that it stays visible when scrolling to the right.
